How do I interpret a principal component analysis or similar?
On the wildestmediterranean page, we aim to disseminate various aspects of ecology, as well as research work primarily conducted on the Mediterranean. Naturally, we do this from the perspective of our research, which is why many of the entries are related to metabolomics, a technique we use in this research group to address ecological questions. The use of omics technologies necessitates an adaptation from the more ‘conventional’ way of handling data to a more integrative approach.
We must consider that in traditional experiments, we often have few data points from many animals. For example, if we want to study the effects of nutrition on zebras in the Masai Mara, we would try to analyze data such as the number of births, surviving offspring at one year, growth, survival, among others. We would analyze this across many animals, the more the better.
However, the way of thinking in experiments that use metabolomics is completely the opposite; we typically have few individuals, and in a complete metabolomic analysis, we can analyze up to a total of 15,000 different metabolites. This is why the way we interpret and analyze the data will be entirely different. In this context, by probability, if we have so much data, some will be different from others, which is why we need to try to analyze it in a more integrative way, and this is where principal component analysis comes in.
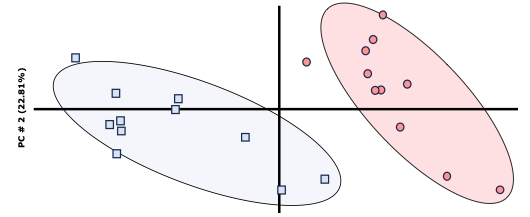
The interpretation is quite simple; it just tries to ‘group’ all the analyzed variables. In this way, the closer the ‘points’ are, the more they will ‘resemble’ each other, and the farther apart they are, the more different they will be. We can assert that the populations are distinct when there is no overlap between them, as shown in Image 1, where the shaded areas of blue and red do not coincide.

Image 1: Example of principal components.
Published by:
Pablo Jesús Marín García
